Insights Analysis
Overview
Introducing: Insights Analysis
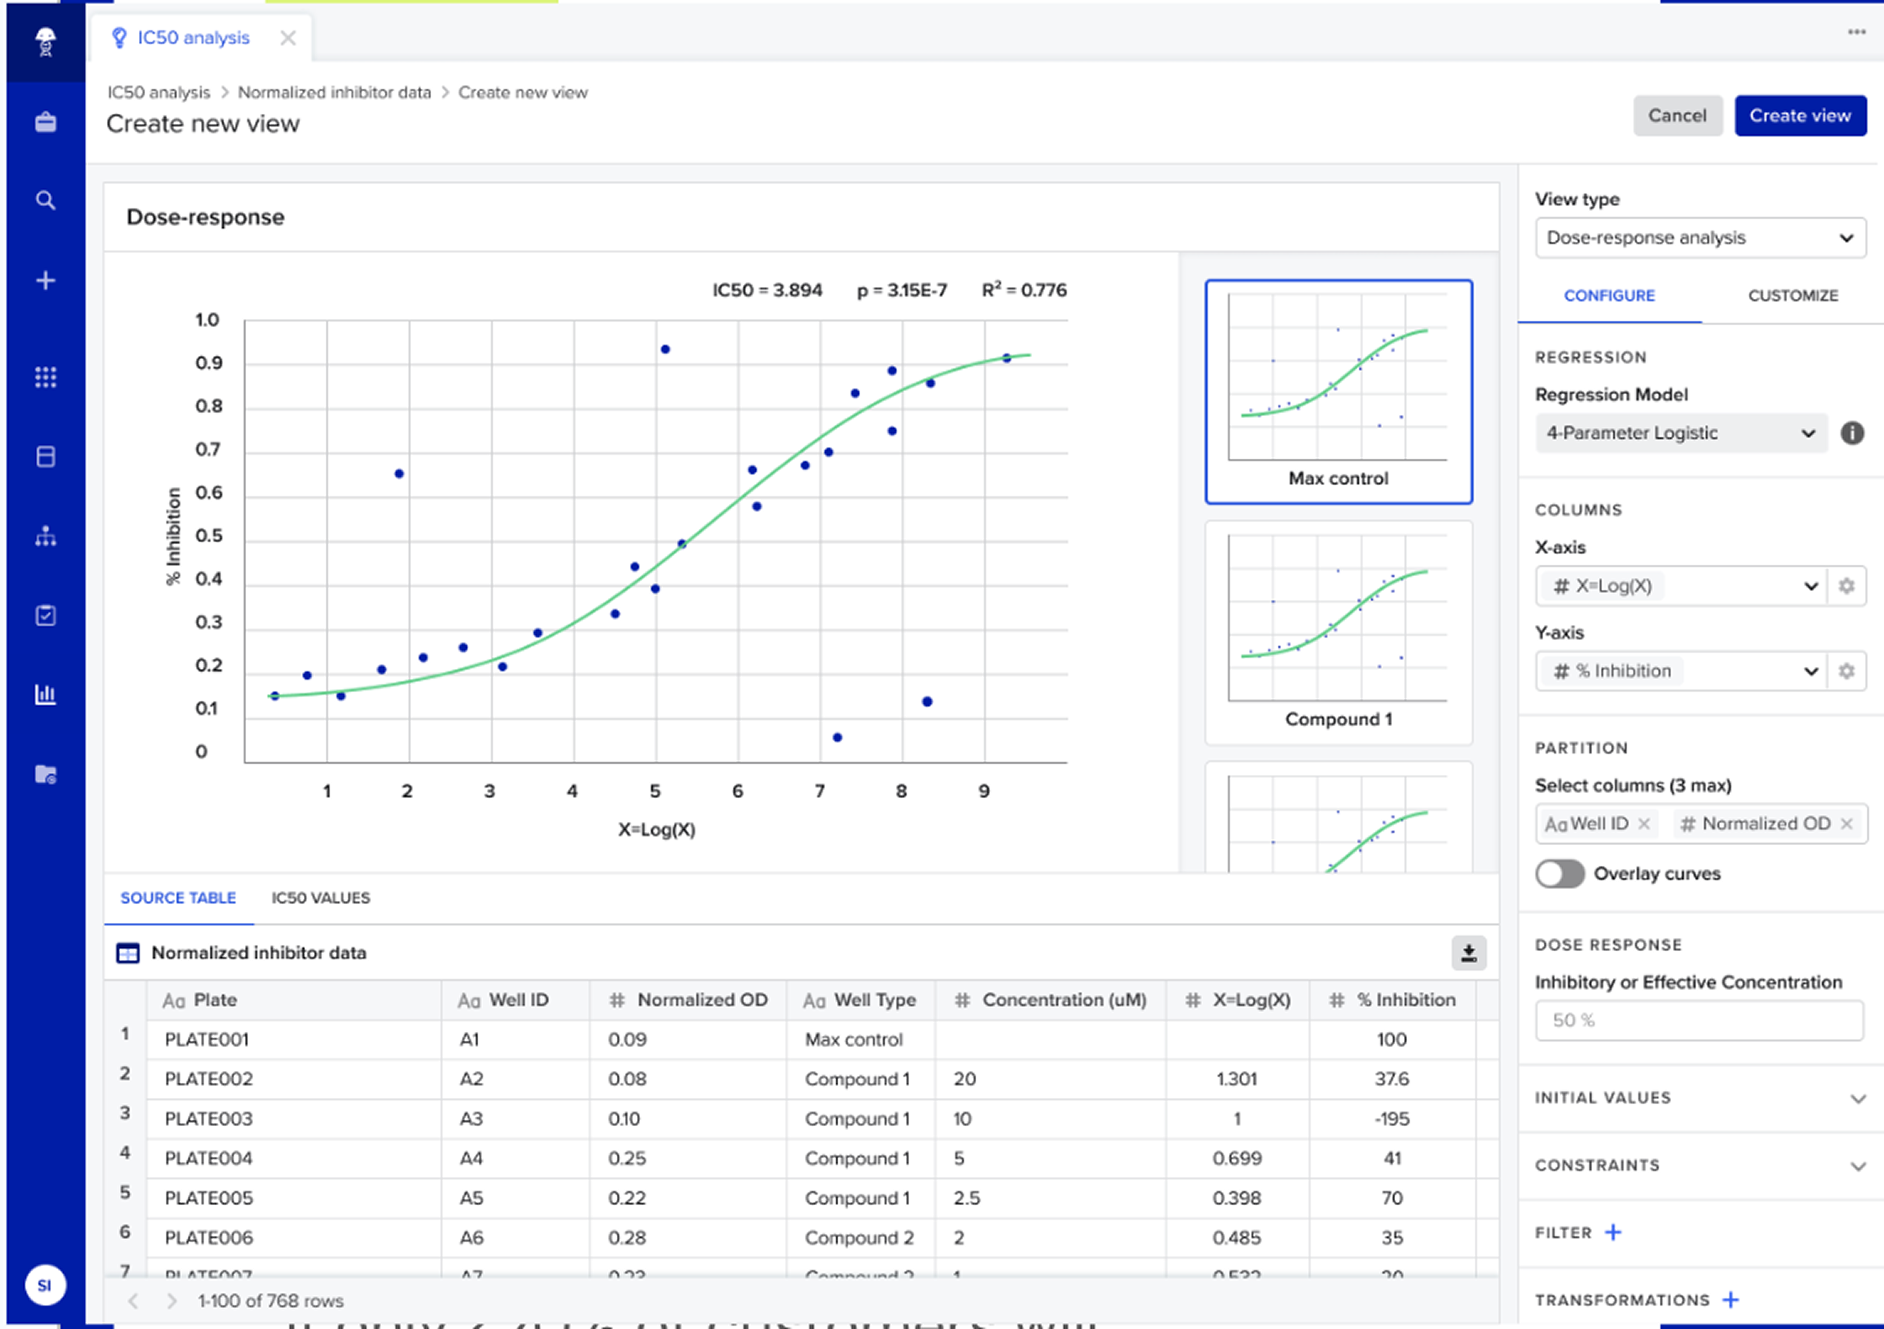
Scientists need to analyze raw experimental data in order to make meaningful sense of it. Previously, Benchling customers used Insights Dashboards to analyze experimental data by creating and running SQL queries. In June 2024, I took a break from molecular biology and worked with the analysis team to build Insights Analysis. The Analysis tool allows users to visualize, interact and transform experimental data iteratively.
Reduce error and manual work
Minimizes manual data handling and tool-switching, reducing human error by keeping analysis within Benchling
Unlock insights with no code
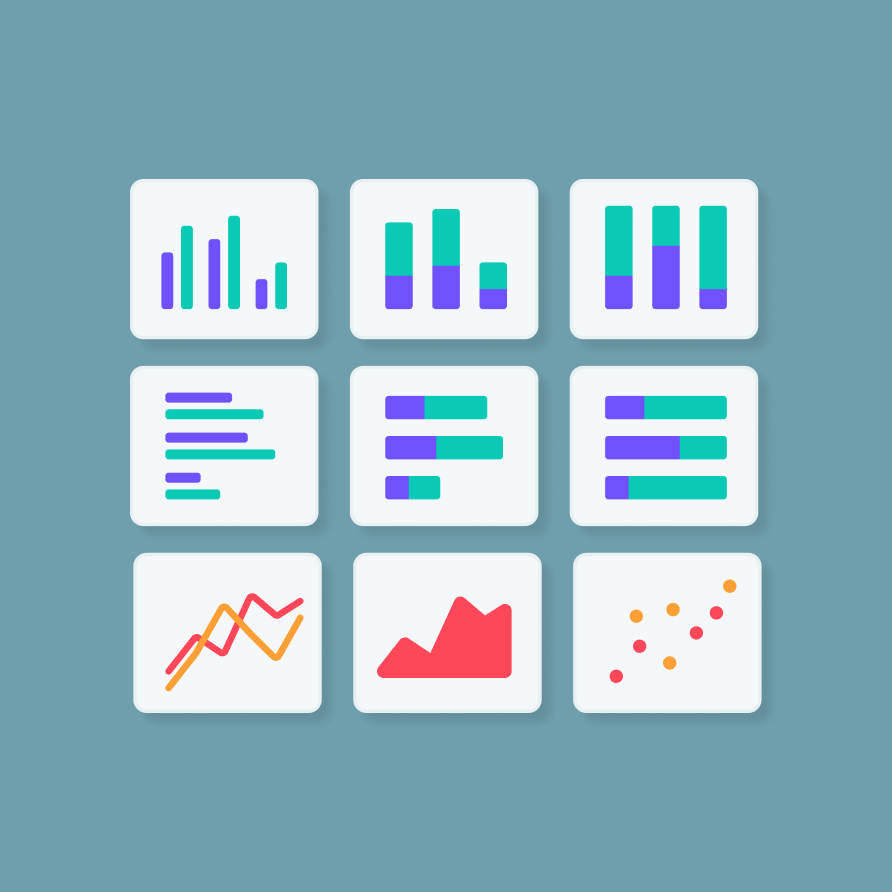
Enables scientists to explore and visualize data using simple, intuitive tools without writing SQL
Scientific analysis for scientists
Grounded in scientists’ real workflows ensure the tool feels intuitive, purposeful, and aligned with their day-to-day analysis needs
Problem
A scientific analysis tool not built for scientists
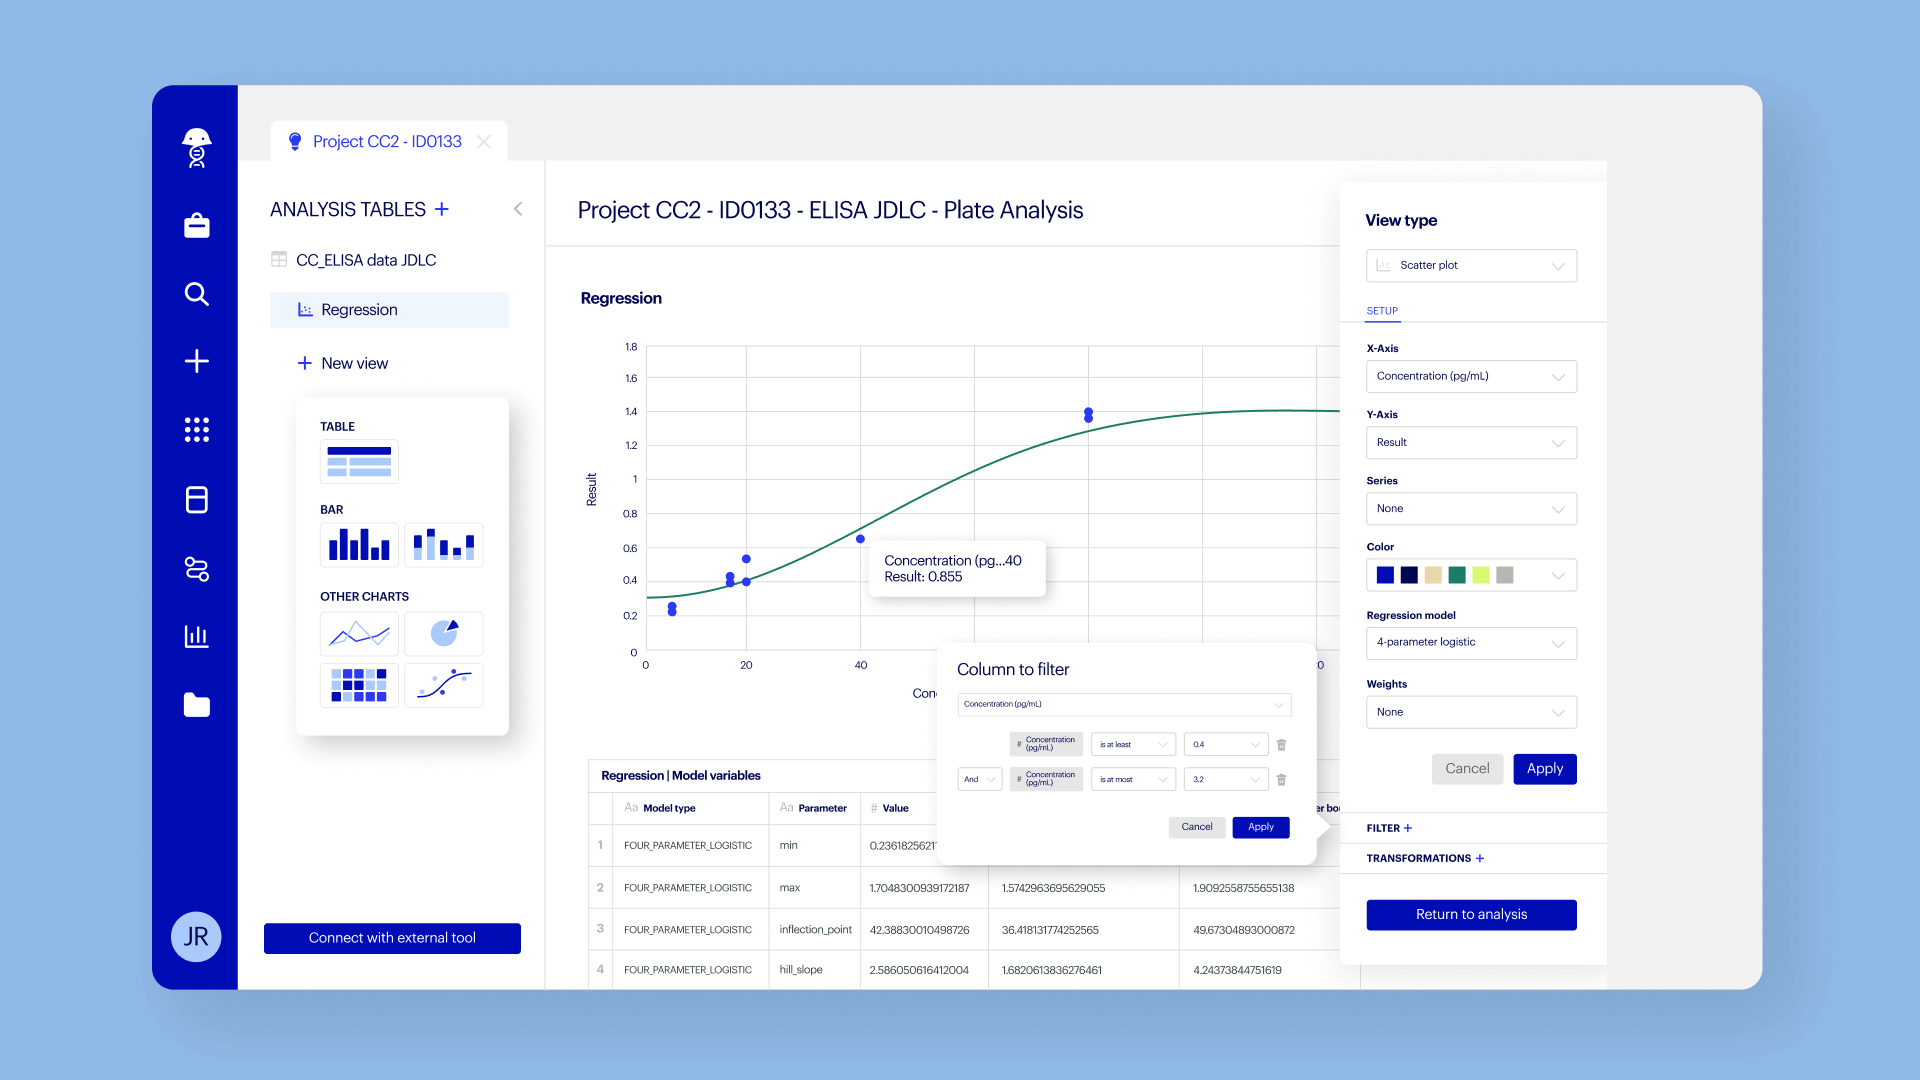
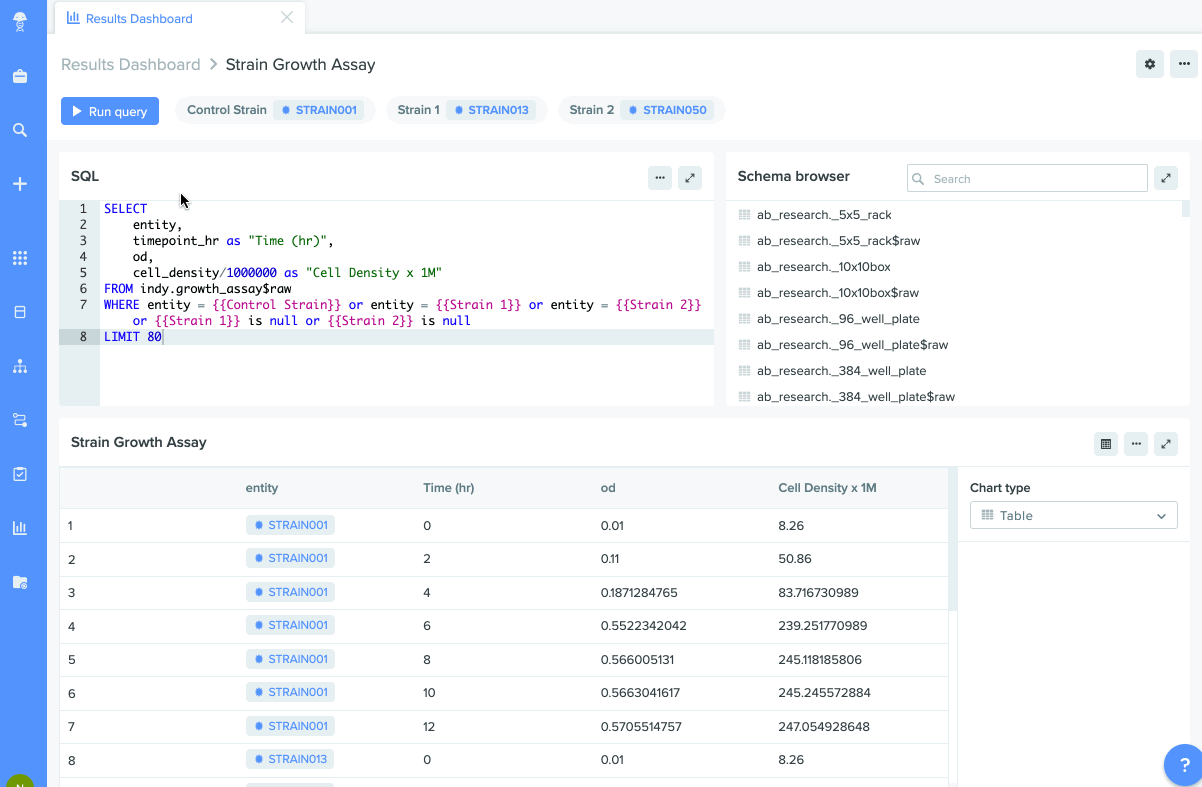
Raw data outputted from lab instruments is messy. Sometimes all it takes is a quick tidy: filtering, reshaping, outlier removal. Sometimes scientists have to do a deep clean: curve fitting, harmonizing, doing linear regressions. Benchling allows scientists to do both via SQL queries that extract existing data. The flexibility of SQL makes Insights a very powerful tool for technical users, but difficult to use for many lab scientists who are not comfortable writing code.
Optimizing for lab scientist use cases
The lab scientist's responsibilities include: performing experimental procedures, analyzing results of experiments through statistical analyses, and generating reports for their manager to review findings. They ask experiment specific questions such as: What were the results of this assay? Are there any unusual outliers in this data? Do I need to re-run this assay? These questions can often be answered through simple raw data transformations and basic data visualizations.
Use cases
Scientists rely on workarounds, IT teams deal with the consequences
If a scientist lacks the ability to write SQL (which, unsurprisingly, many do) they often analyze raw experimental data using tools they are familiar with such as Excel, JMP, or Prism. This disruption often leads to many scientists not bringing analysis results back into Benchling, leaving experiments only partially captured within the platform.
For IT teams, in order to manage this problem, they either have to incentivize scientists to learn SQL or continue to maintain a distributed software stack to accommodate preferred point-solution analysis tools.
Solution
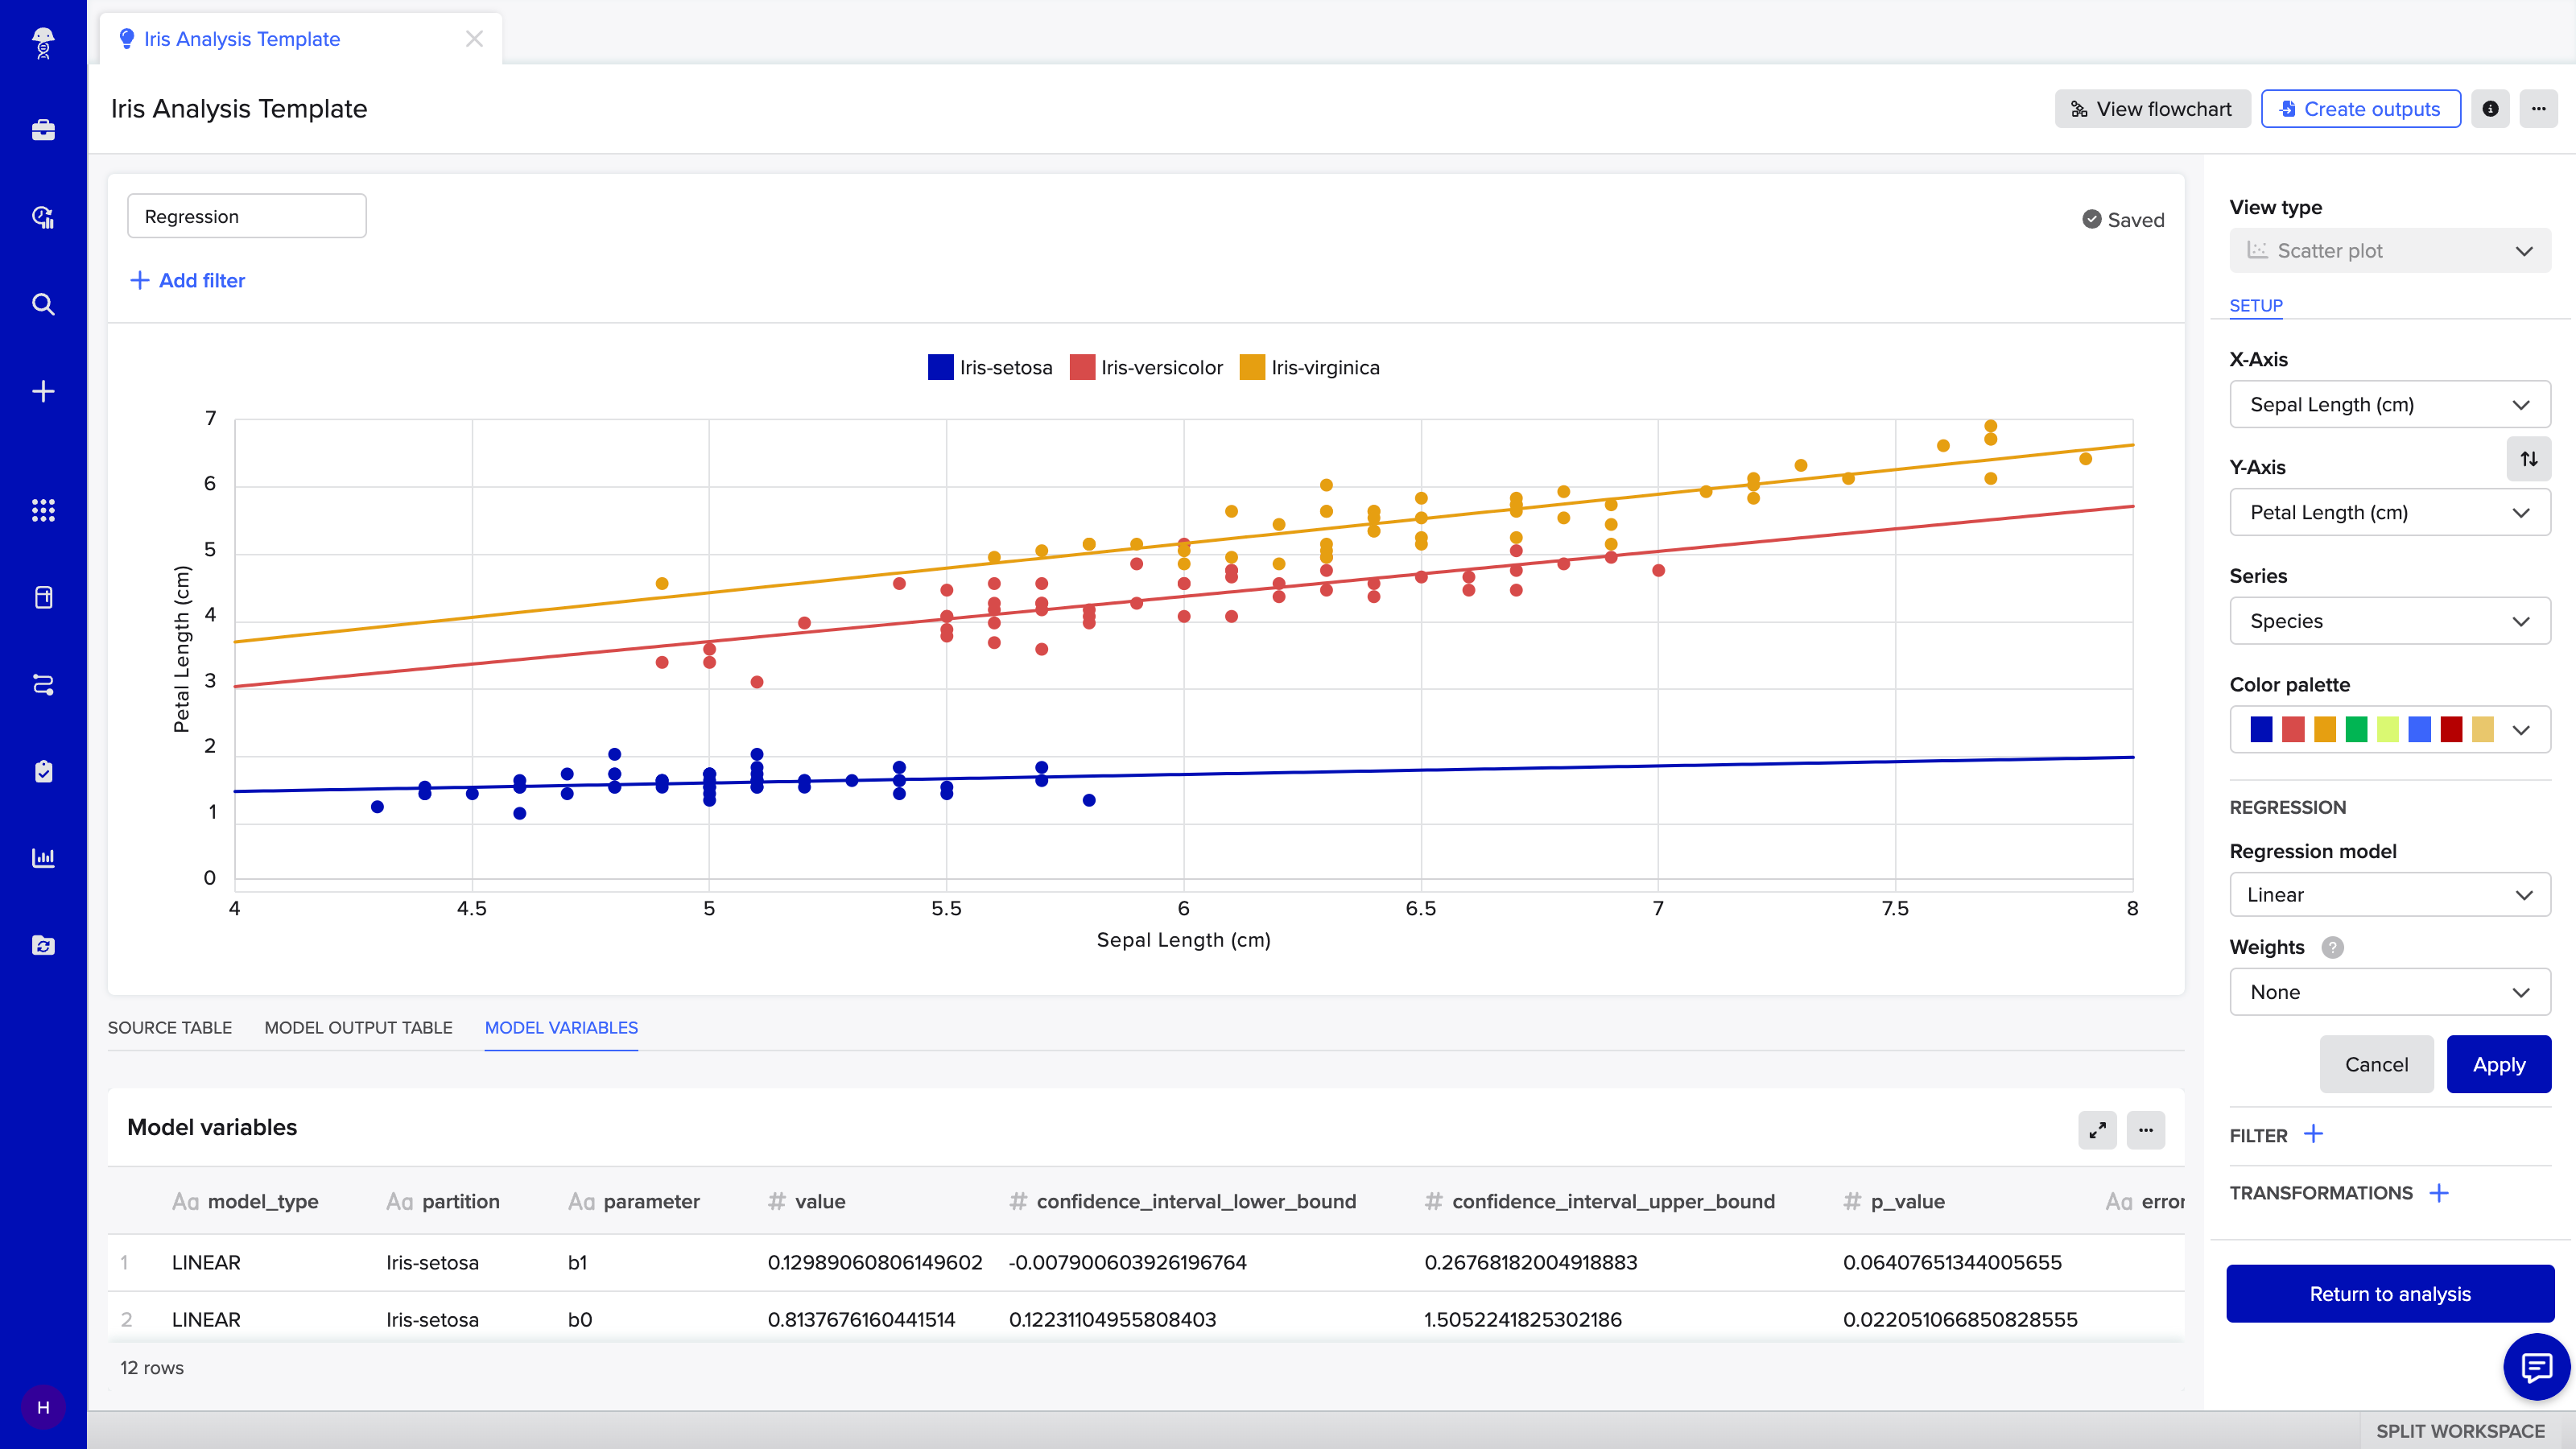
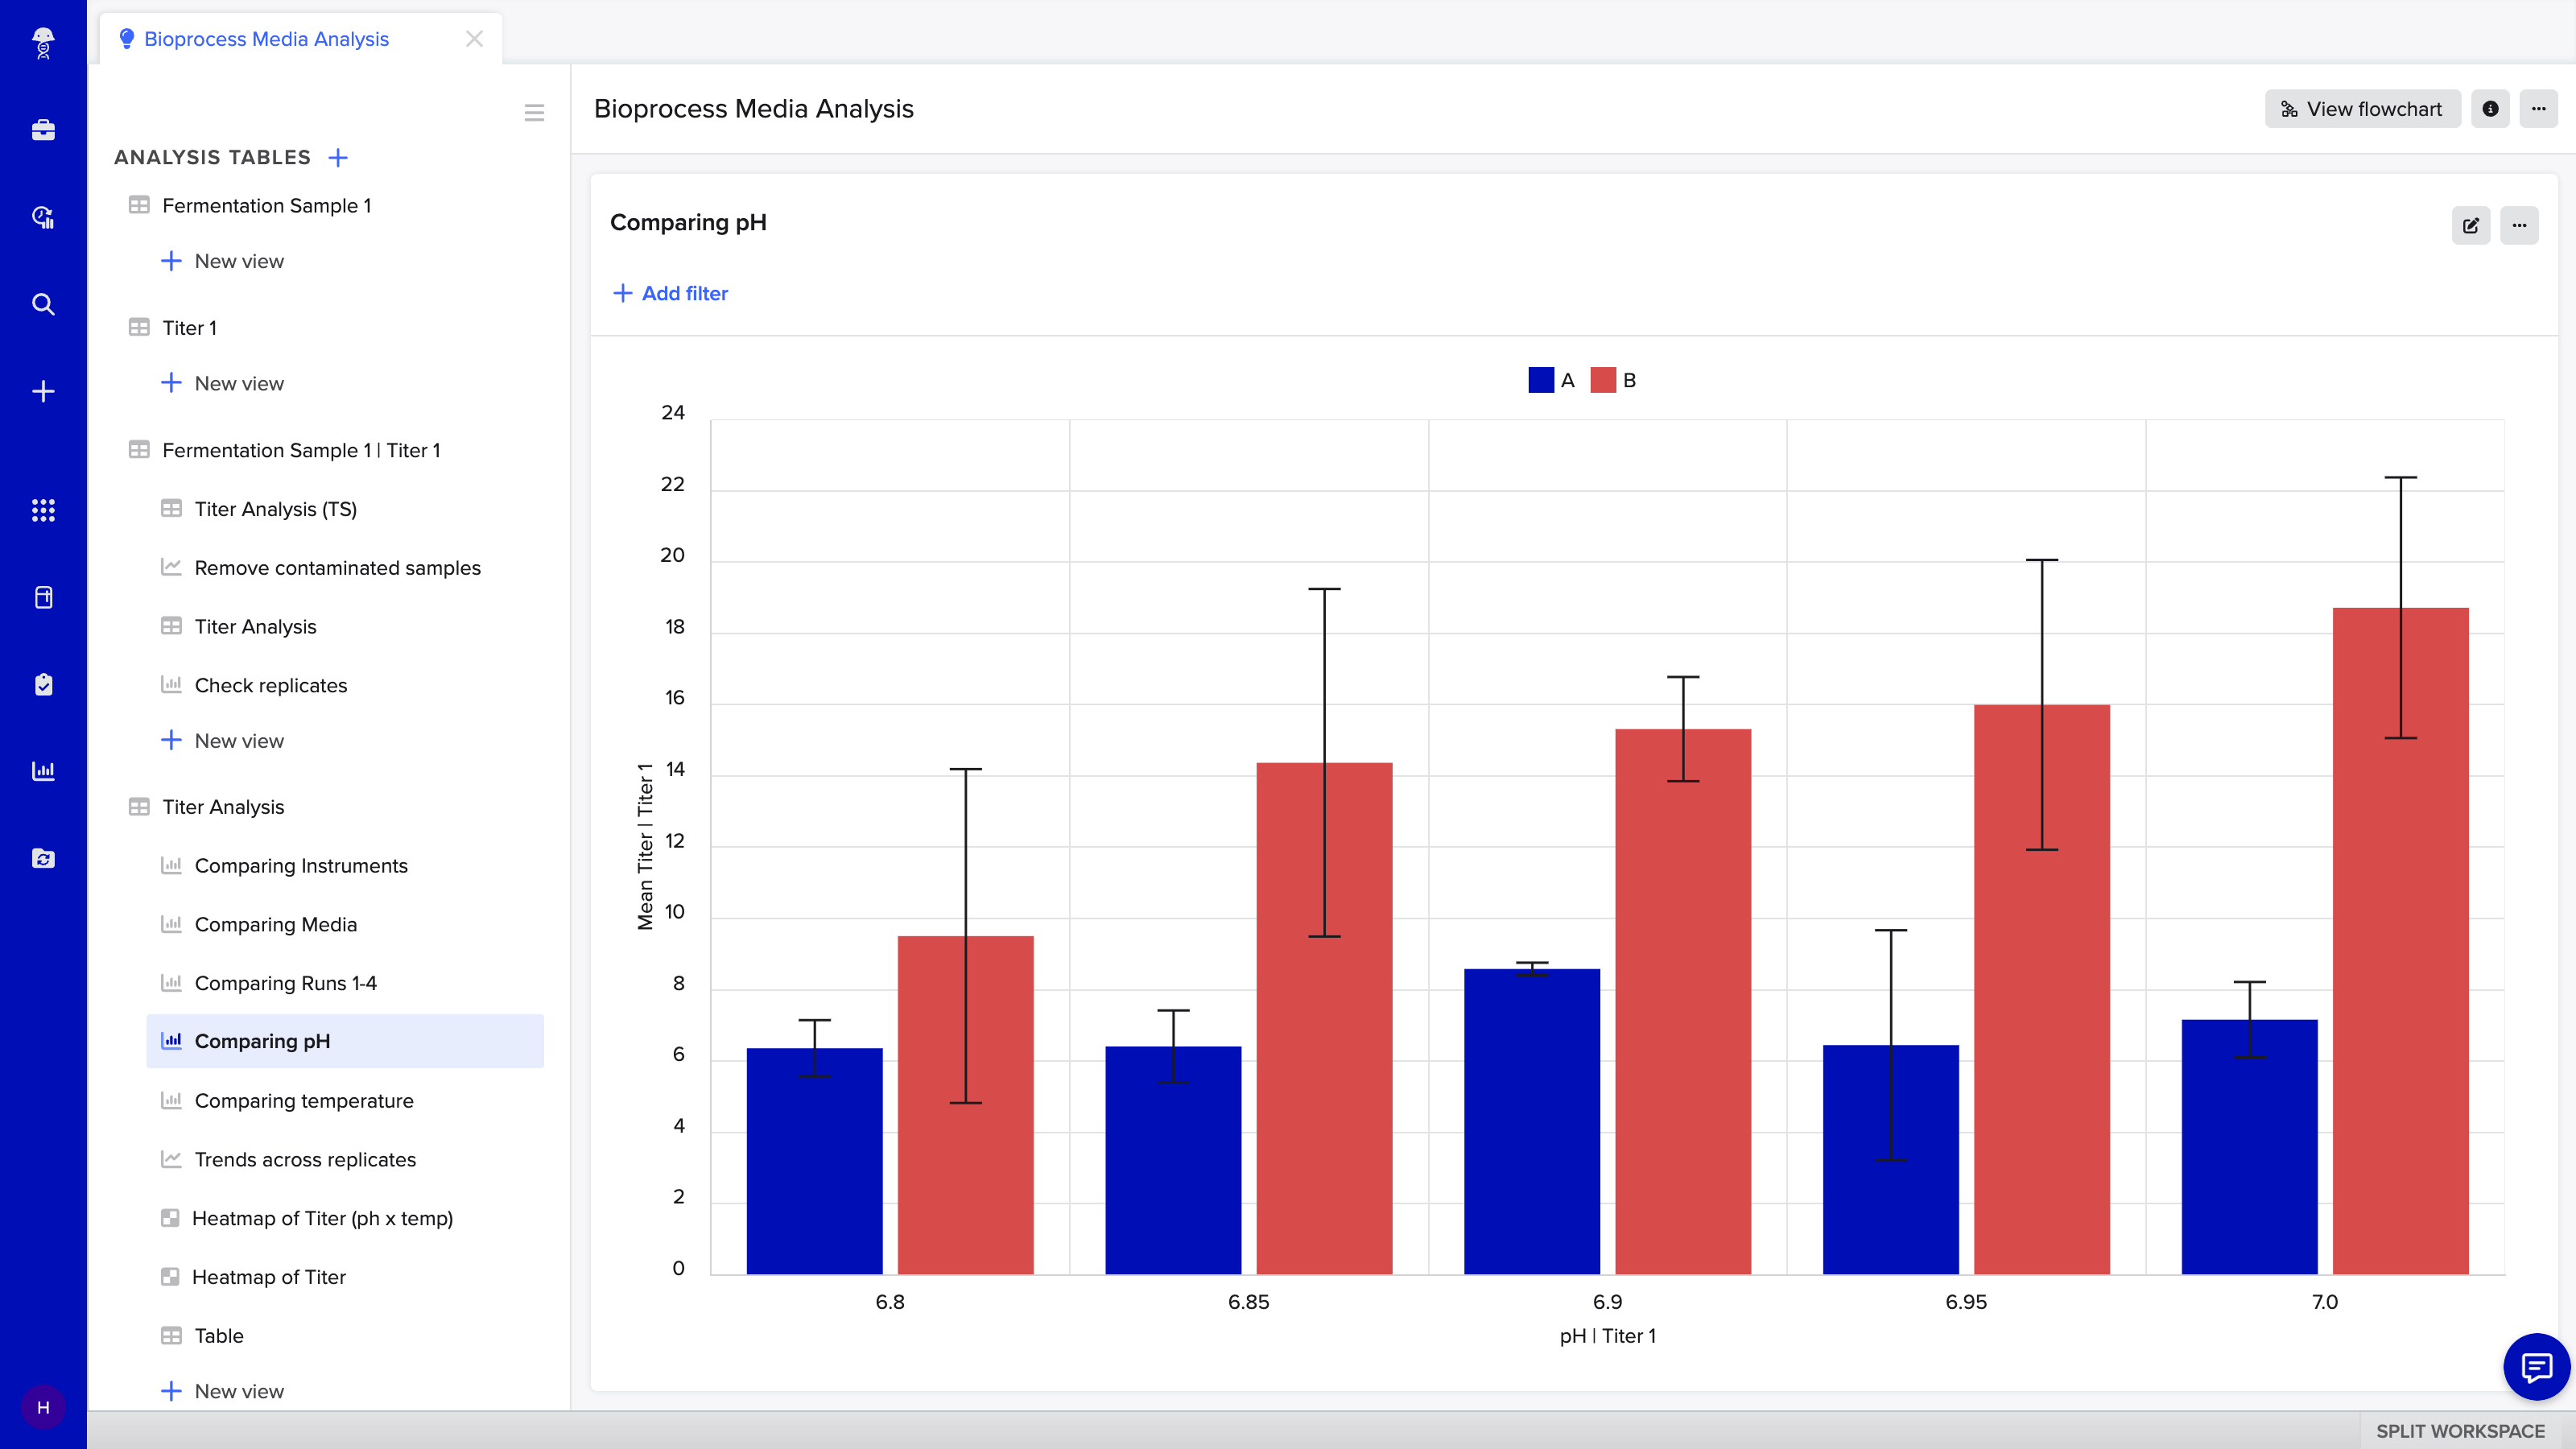
A point-and-click analysis tool to help lab scientists answer experimental questions
Insights Analysis empowers users to answer scientific questions without leaving Benchling, improving the efficiency and quality of workflows, reducing the time spent on manual tasks like data wrangling and confirming data quality, and reducing the chances of errors when shuttling data from one tool to another.
Benchling's Insights platform offers robust tools for data analysis, enabling users to create, manipulate, and visualize datasets derived from various sources within the Benchling ecosystem. The key considerations that influenced the designs were:
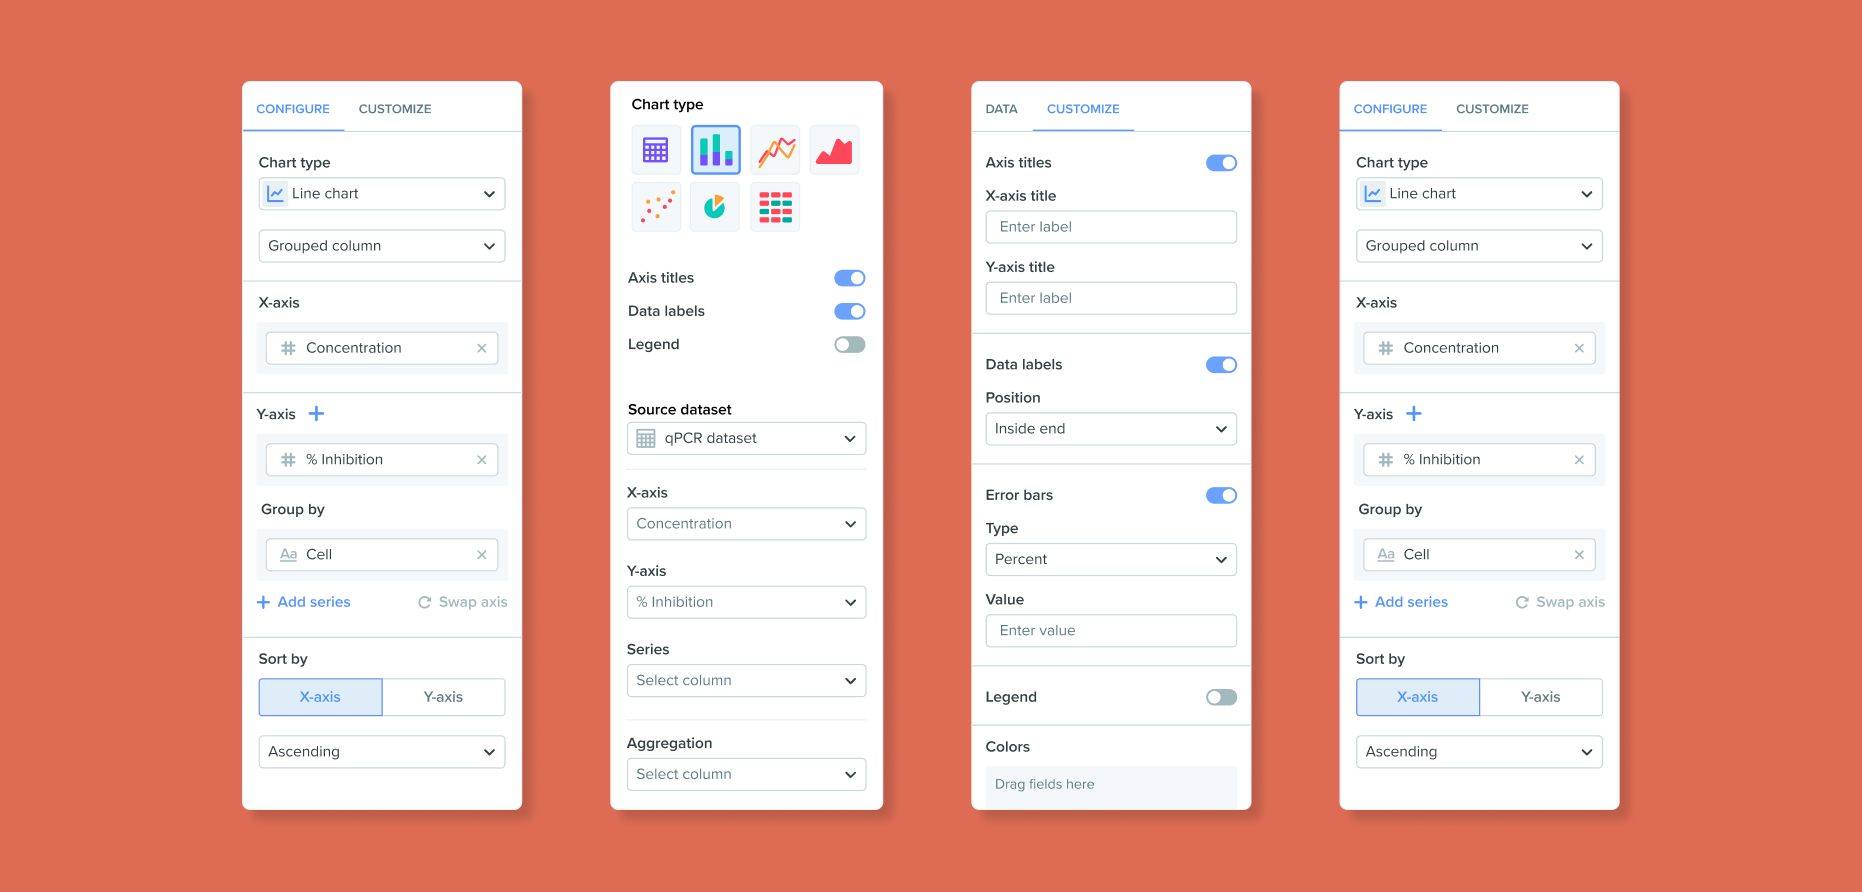
- Clarity over complexity - We optimized for an easy-to-use charting experience that is straightforward and simple. We would rather get MVP feedback that “it’s easy-to-use but they want more features” vs. “they can see the flexibility, but don’t know how to use it”
- Aware of scientific workflows - We are not building a general purpose analytics tool. We understand our customers’ workflows and scientific context of the work they’re doing, so we can build simple UX to enable their specific workflows.
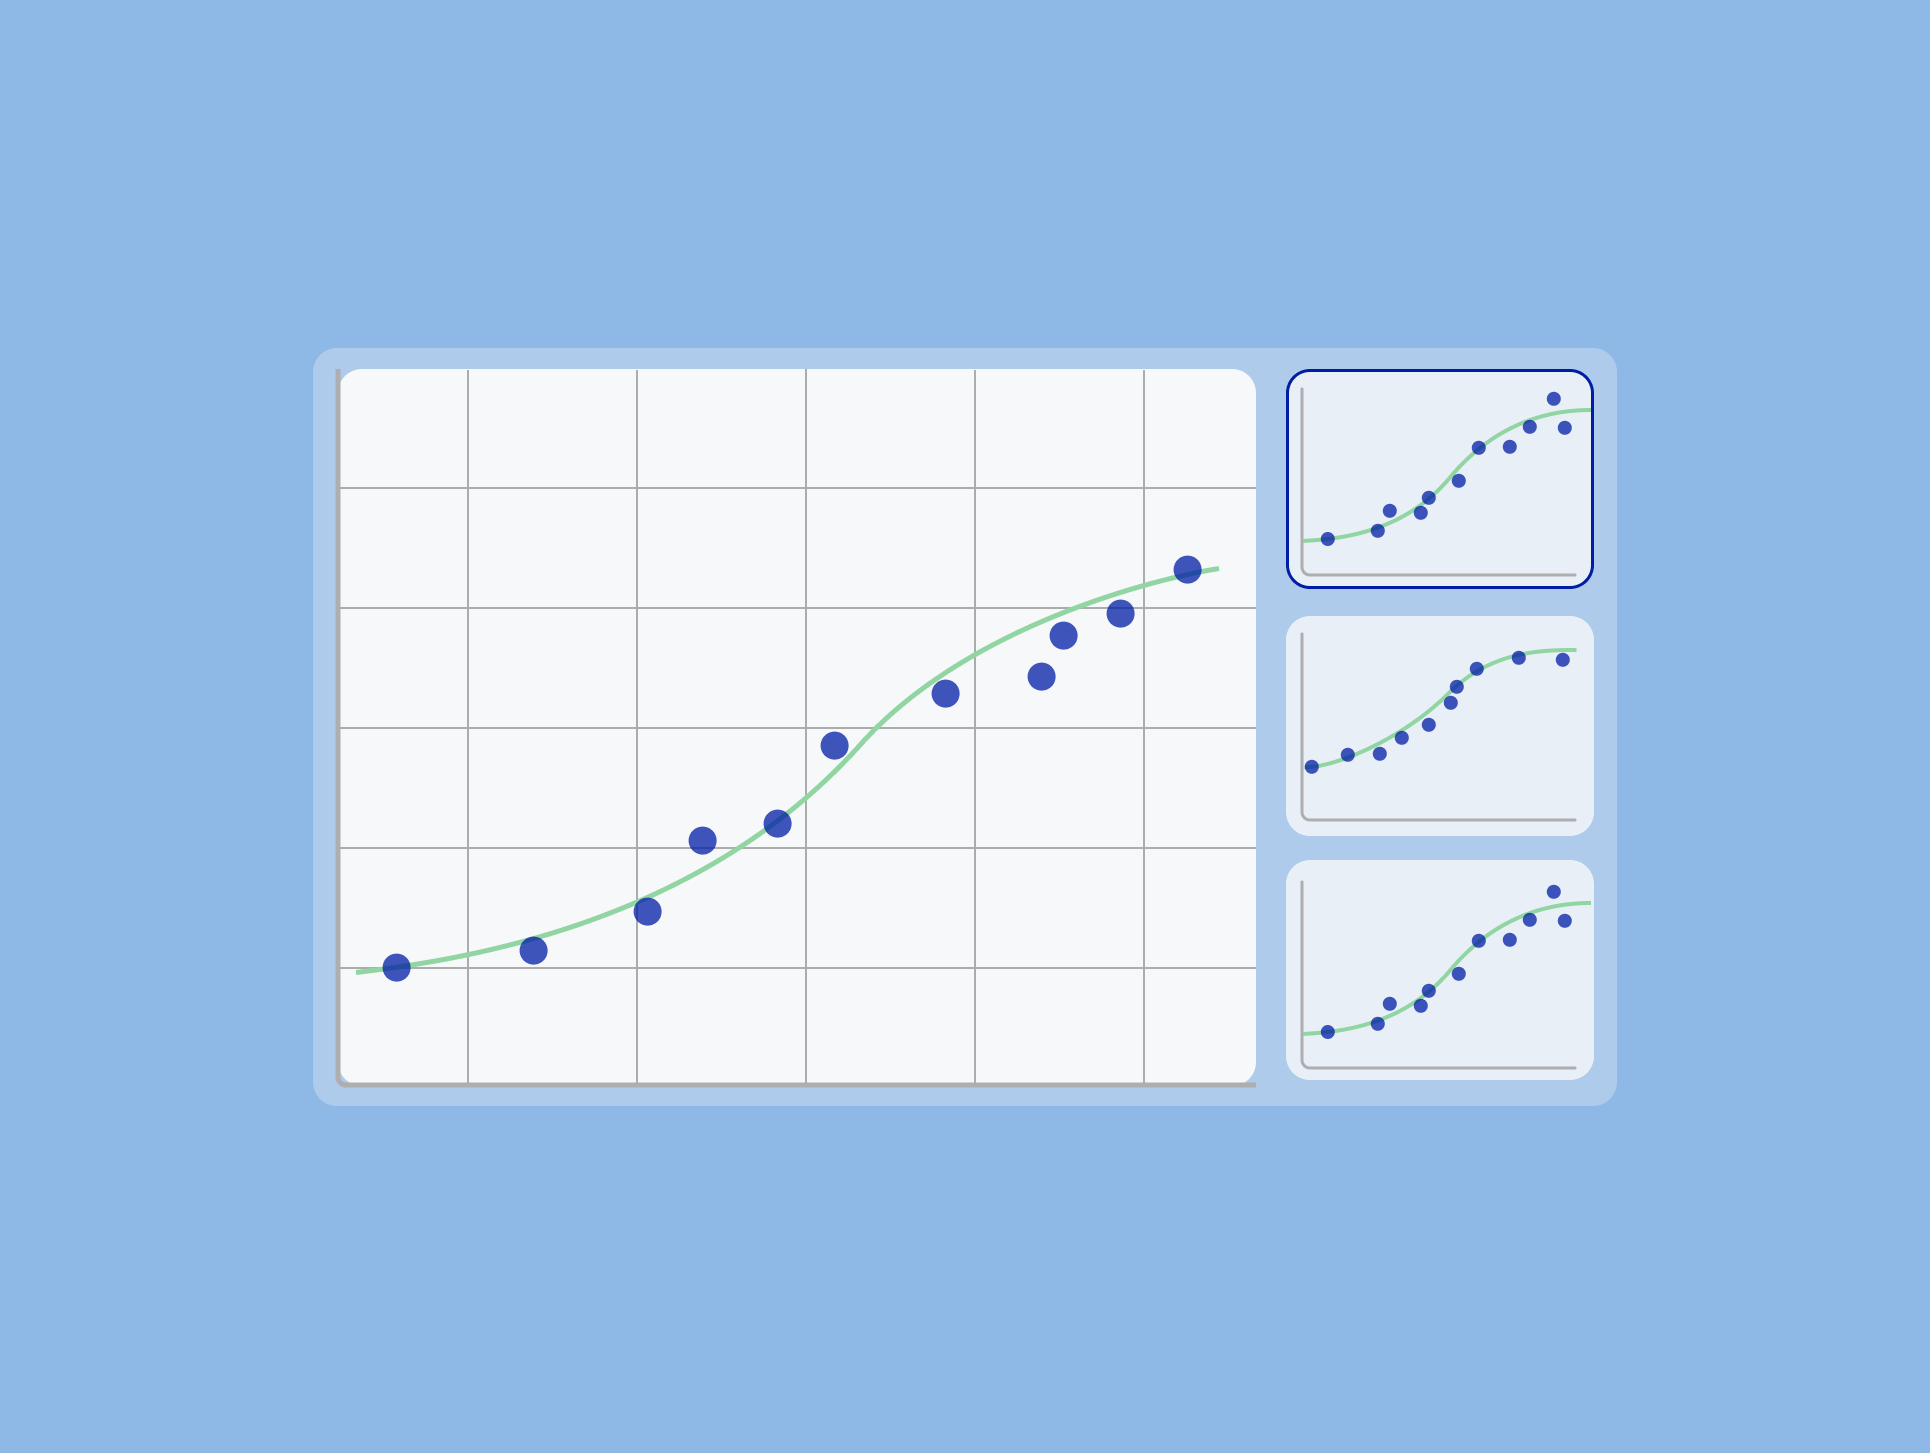
Supporting scientific analysis methods


Outcome
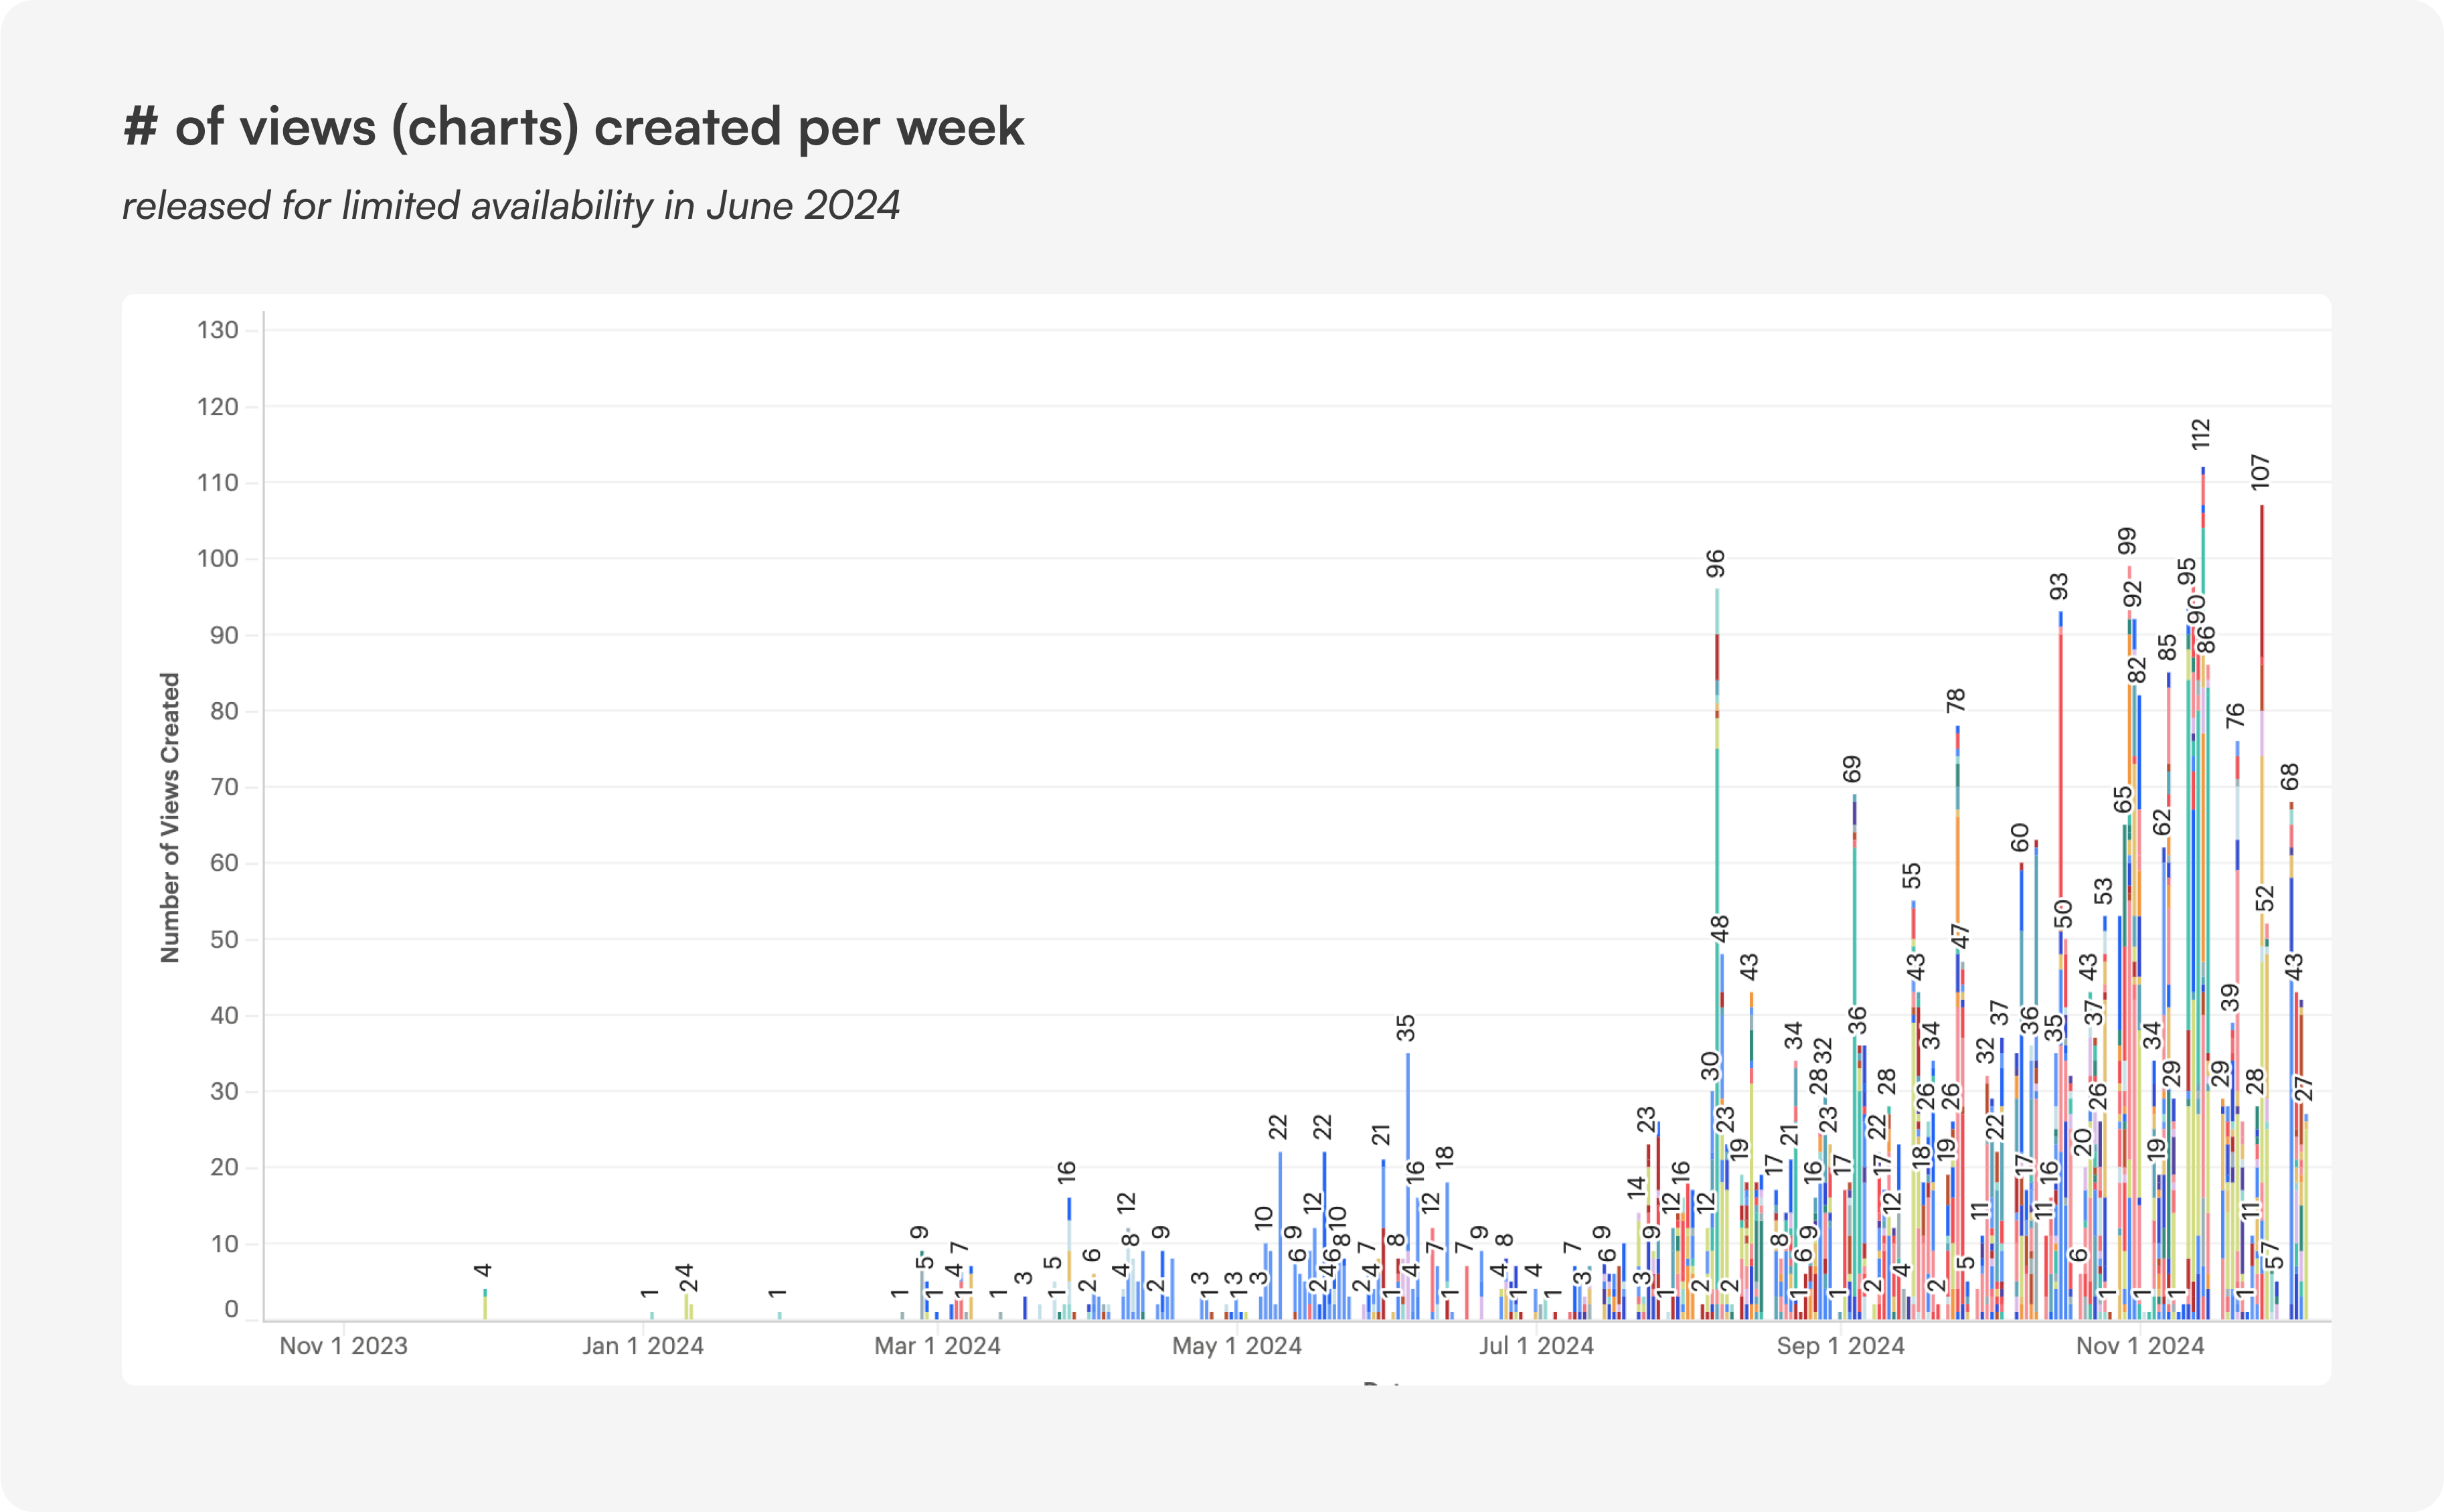
Strong early adoption and sustained engagement post-launch
Insights analysis released for general availability in August 2024.
Within the first month...
- 3.9K+ chart visualizations created
- Adopted by 80 customer accounts
- Utilized by 110+ active users
Within the first year...
- 24.5K+ chart visualizations created
- Adopted by 226 customer accounts
- Utilized by 430+ active users